

October is National Cooperative Month!
October 10, 2024
USDA - Cooperative Service Branch
Agricultural cooperatives experienced strong results in 2023 despite dips in business volume, income, and assets
This bulletin provides a brief summary of cooperative statistics from USDA’s annual survey of the Nation’s agricultural cooperatives for fiscal year 2023.
October 9 ,2024
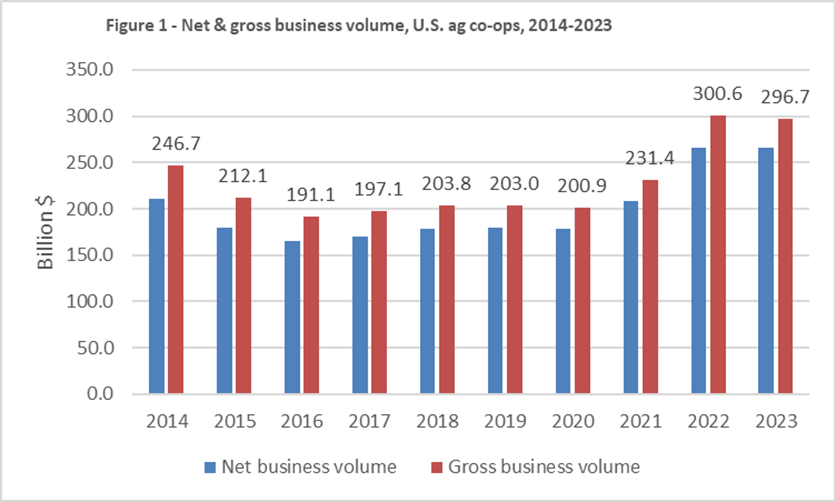
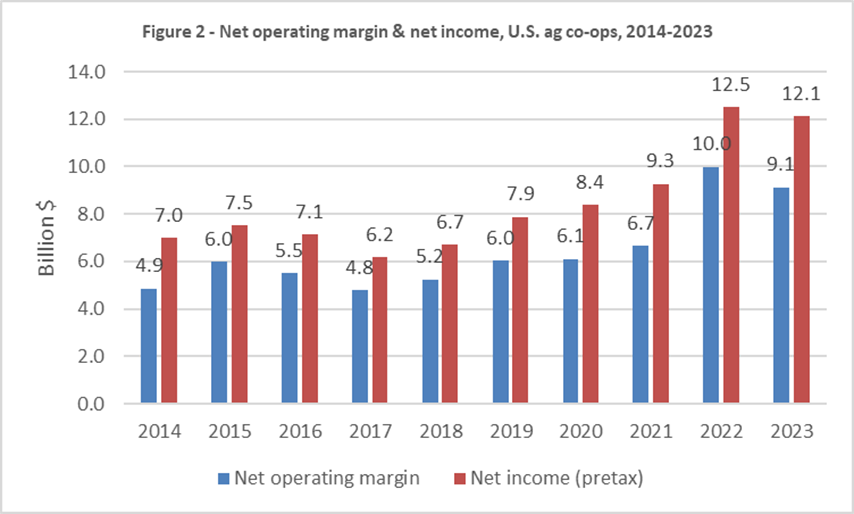
USDA’s annual survey of the Nation’s 1,647 farmer, rancher and fishery cooperatives showed that cooperatives achieved the second highest revenue year on record, just slightly below 2022’s record breaking year with of $296.7 billion in total gross business volume. Net income before taxes was also slightly lower than 2022 at $12.1 billion in 2023 (Figures 1 and 2).
- Marketing sales by co-ops dropped 2.2 percent from 2022 to $182.6 billion.
- Supply sales fell slightly, but statistically rounded to the same $106.1 billion in 2023 as they were in 2022.
- Service receipts and other operating income dropped by 3.5 percent to 5.0 billion.
- Gross operating revenue dropped by 1.5 percent to $293.7 billion.
- Total expenses dropped by 0.8 percent from $27.2 billion to $27.0 billion in 2023. Wage expenses increased just ever so slightly (ag co-ops paid $13.3 billion in wages in 2023).
- Depreciation and interest expense also increased, by 2.7 percent and 26.3 percent, respectively. Other expenses fell by 7.2 percent.
- Patronage received from other cooperatives increased by $451 million to $1.2 billion and non-operating income also increased slightly and rounded to the same $1.8 billion as in 2022.
- These factors together resulted in a 3.2 percent drop in net income before taxes, but the amount was still significant at $12.1 billion. This net income is important as it allows co-ops to return earnings to members in patronage and equity redemption, and/or strengthen balance sheets, and/or to invest further in operational assets for continued prosperity and service to members. Return on assets improved in 2023, while return on allocated equity fell by 2.8 points.
- Total gross business volume – the aggregation of sales, service receipts and other operating revenue, patronage received, and non-operating income – was $3.9 billion lower than 2022, at $296.7 billion in 2023.
- Net business volume (eliminating the $30.9 billion of sales between cooperatives themselves) was $265.8 billion, down $209 million from 2022.
Balance sheet strong
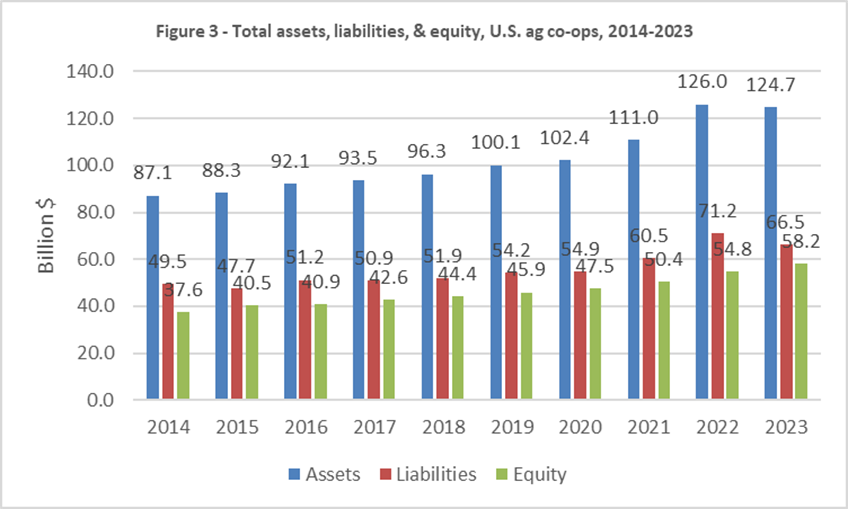
The combined balance sheet for the Nation’s ag co-ops remained strong, with total assets of $124.7 billion ending up close to the previous year’s record of $126.0 billion. However, member equity hit a record in 2023, up $3.4 billion from 2022 at $58.2 billion (Figure 3).
- Assets fell just 1.1 percent, while equity increased 6.1 percent in 2023. Investments in property, plant and equipment (fixed assets) by ag co-ops – including grain elevators, warehouses, farm supply stores, petroleum/convenience stores, fertilizer and feed plants, major food and beverage processing plants, etc. – increased, to a record $36.2 billion, up $1.8 billion from 2022.
- Total liabilities, however, decreased to $66.5 billion in 2023, down 5.6 percent from $71.2 billion.
- Allocated equity and retained earnings increased in 2023, reaching $30.3 billion and $27.8 billion, respectively.
- For 2023, the balance sheet ratio of debt-to-assets dropped o 53.3 percent, but equity to assets increased to 46.7 percent.
Sales category changes
Net business revenue in 2023 increased in the commodity sectors of beans and dry peas, fruit and vegetables, grains and oilseeds, livestock, poultry, rice, sugar, and tobacco, while falling in cotton, cottonseed, milk and milk products, fish, nuts, wool, and other marketings. The highest marketing increases were in sugar (up 26.8 percent), beans and dry peas (up 25.4 percent), livestock (13.7 percent), and rice (11.0 percent). Falling revenue occurred most in cottonseed (down 28.5 percent), cotton (down 27.4 percent), and dairy (down 7 percent). Overall, net sales of commodities dropped by $2.1 billion, from $179.8 billion in 2022 to $177.8 billion in 2023.
For supplies, four out of five categories increased in sales in 2023, with other supplies being the exception. Feed sales increased the most, up $477 million to $15.3 billion, with petroleum (i.e., energy products) second, up $462 million to $25.0 billion. Crop protectant sales grew by $298 million to $10.2 billion and fertilizer sales by $226 million to $18.7 billion. Seed sales were $4.5 billion and other supplies were $6.4 billion. Overall, supply sales increased by $1.6 billion to $80.1 billion in 2023.
Cooperative numbers and types
The number of ag co-ops continues to decline. In 2023, USDA counted 1,647 farmer, rancher and fishery co-ops, down from 1,671 in 2022, a drop of 24 co-ops. While there are some co-op dissolutions occurring each year, the major cause for the decline in numbers is the continuing trend of mergers among cooperatives. Co-ops are merging to gain further economies of scale, increased efficiency, greater regional reach, and to better position themselves for future strength and growth.
In 2023, 851 co-ops (51.6 percent) predominantly marketed commodities, and the other 796 consisted of 688 farm supply co-ops and 108 service co-ops (i.e., those that provide storage, transportation, information, or agronomy services, etc.).
For marketing co-ops in 2023, grain and oilseeds were the major commodities of 330 co-ops, cotton and cottonseed of 113 co-ops, fruit and vegetables of 96 co-ops, milk and milk products of 93, livestock and poultry (including eggs) of 57, and fish of 37 co-ops. The other 125 co-ops market wool, dry beans and peas, nuts, rice, tobacco, and various other commodities.
For 2023, 651 co-ops were further categorized as just “marketing” while 200 were labeled as “mixed marketing.” Among farm supply cooperatives, 521 co-ops depended on supplies for 100 percent of their sales (categorized “farm supply”), while 167 co-ops were “mixed farm supply.”
While cooperatives are categorized based on a majority of sales in specific areas, many co-ops have very diverse operations, conducting two or three primary service functions for members. Some co-ops not only market their members’ products – including crops, milk, livestock, fruit/vegetables, poultry and fish – but also conduct value-added processing and brand marketing, sell farm production supplies and/or provide members with a variety of on-farm and operational services.
It is worth noting that while the numbers of ag co-ops have been dropping, those that remain continue to operate 9,531 locations across all 50 States. In addition to headquarters, ag co-ops had 7,884 other locations consisting of separate branch facilities, plants, elevators, c-stores, service centers, and other types of locations in 2023.
Structural characteristics, memberships, employees
Most ag cooperatives are centralized cooperatives – largely local or state-wide co-ops with individual members. Some centralized co-ops operate over multi-state areas and provide more vertically integrated services, such as further processing products or manufacturing feed. The number of centralized co-ops dropped by 32 from 1,570 to 1,538 from 2022 to 2023.
There were 29 federated ag co-ops and the 70 mixed co-ops was an increase of 7 from 2022. In a federated cooperative, two or more individual-member cooperatives have organized to jointly market products, purchase supplies, or perform service or bargaining functions. In mixed co-ops, the membership includes other co-op associations as well as direct memberships of individual producers.
- Memberships were reported at 1,773,309, down by 67,277 members from 2022. Not all farmers, ranchers or fishermen belong to a cooperative, but many producers belong to two or more co-ops. For instance, a dairy farmer may market milk through a dairy co-op while buying farm production supplies and services from supply co-ops.
- Ag co-ops reported 191,543 total employees in 2023, 2.724 more than in 2022, and 21 percent of those (40,221) were part-time or seasonal employees.
- The average board size for co-ops with sales up to $99.9 million in sales was 7, co-ops with sales from $100 million up to $1 billion had an average board of 10, co-ops with sales of more than a billion dollars had 15 directors, and overall, average board size for the population of co-ops was 8.
Top Cooperative activity States
Forty-nine States are home to headquarters of at least one ag co-op. Four States are home to the headquarters of 100 or more ag co-ops: Minnesota (139), Texas (134), and North Dakota (107), and California (100). Wisconsin was next with 93 co-ops headquartered there, followed by Illinois with 79.
In 2023, the number of ag co-ops with operations in two or more States was 210, while the remaining 1,437 operate within one State. Minnesota had 185 ag co-ops conducting business in the State, followed by Texas with 163, North Dakota with 131, California with 123, Wisconsin with 117, and Illinois with 109.
Iowa was the leading state for co-op net business volume, at $30.6 billion by 98 co-ops, which includes sales from all co-ops with operations in the State, not just those with headquarters there. Minnesota ranked second with $23.8 billion (185 co-ops), followed by Illinois with $20.5 billion (109 co-ops). Then comes California with $16.8 billion, Nebraska ($12.4 billion), Wisconsin ($12.0 billion), Kansas ($10.3 billion) and North Dakota ($10.2 billion). The top 20 States of sales conducted by ag co-ops accounted for $211.6 billion of the total net sales of $257.8 billion, or 82.1 percent.
Co-ops importance in Rural America
Agricultural cooperatives have been a mainstay in rural America for more than a century. USDA’s cooperative database shows that:
- 390 co-ops (24 percent of all ag co-ops) are 100 or more years old
- 55 percent (909 co-ops) are 75 years or older
- 78 percent (1,277 co-ops) are more than 50 years of age
Ag co-ops are an efficient and sound marketing channel for their members’ commodities, many adding value to products, further benefitting member-owners. Co-ops also continue to provide supplies and services members need to operate their operations in a challenging agricultural environment.
Ag co-ops are an efficient and sound marketing channel for their members’ commodities, many adding value to products, further benefitting member-owners economically. Co-ops also continue to provide supplies and services members need to operate their operations in challenging agricultural and economic environments.
Overall, the data show that ag co-ops are well managed, efficient, and financially solid, helping to provide a strong foundation for the viability of the rural communities in which most producer-members live and where many of the thousands of co-op facilities are located. Ag co-ops also boost the economies of many less-rural cities where co-ops may have offices, plants, or other facilities. Co-ops are investing in their operations, as evidenced by the record fixed asset and total asset levels attained in 2022.
A strong benefit for producers marketing and purchasing through their cooperatives is that they at least get to experience the opportunity to share in the record income through patronage refunds on the business they did with the cooperative, dividends on preferred stock they own, or the retirement of equity they have in the cooperative. The continued strong performance of ag co-ops in 2023 shows that the time-tested, member owned and governed co-op business influence remains as important as ever to America’s producers and to the overall performance of the food and fiber system, which significantly benefits consumers as well.
|
A more comprehensive 2023 summary bulletin is available: the full bulletin contains 8 charts and 4 tables. To receive a copy of the full bulletin, please email your request to coopinfo@usda.gov Bulletin Link: https://content.govdelivery.com/accounts/USDARD/bulletins/3baf0e3 The Top 100 Ag Co-op summary bulletin for 2023 will be delivered tomorrow, 10/10/2024.
|